Sensor Array Optimization
You are welcome to cite our paper if you utilize SeisCloud (https://seis.cloud) and our code to obtain the sensor locations in the arrays :
Ding, L., Yang, G., Kravchinsky, E., Popoola, A., Goodfellow, S., Liu, Q., & Grasselli, G. (2023). Quantitative Optimization of Sensor Positions in Laboratory Acoustic Emission Experiments., submitted to Rock Mechanics and Rock Engineering.
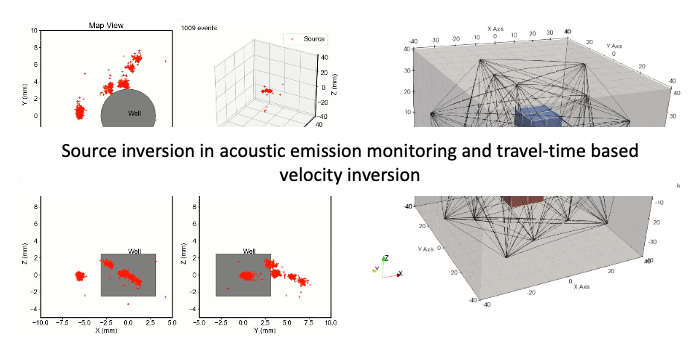
(A standard array with 18 sensors is placed on a sample block. Smaller cubes mark the positions of sensors in the original array, while larger cubes indicate the positions in the optimized array.)
Request sensor arrays from SeisCloud through URL
Sensor positions on the surface of either a block or cylindrical sample can be requested from SeisCloud (https://seis.cloud).
To download a CSV file containing 20 sensor locations on a cylindrical sample with a radius of 50 mm and a height of 100 mm, simply paste the following address into your web browser.
1
https://db.seis.cloud/aecylinders?nsensor=20&radius=50&height=100
To download a CSV file containing 20 sensor locations on a block sample with one vertex at [-32.5, -32.5, -65] and another vertex at [32.5, 32.5, 65], simply paste the following address into your web browser.
1
https://db.seis.cloud/aeblocks?nsensor=20&p1x=-32.5&p1y=-32.5&p1z=-65&p2x=32.5&p2y=32.5&p2z=65
Request sensor arrays from SeisCloud through Python script
See also the example
1 | from DArrays.AEDesigner import Designer |
1 | # Initialize an instance that can request sensor array from SeisCloud (https://seis.cloud). |
1 | # Get sensor locations on a block sample and save as csv file. |
- nsensor: the number of sensor in the array
- [p1x, p1y, p1z]: the first vertex of the block sample.
- [p2x, p2y, p2z]: the second vertex of the block sample.
- [0, 0, 0]: the sample center
1 | # Get sensor locations on a cylinder sample and save as csv file. |
- nsensor: the number of sensor in the array
- radius: the radius of the cylinder sample.
- height: the height of the cylinder sample.
- [0, 0, 0]: the sample center
Note
SeisCloud (https://seis.cloud) undergoes monthly updates. If you encounter any issues, please inform me.
Our website offers a sensor array that includes between 8 to 40 sensors. If you’re interested in optimizing a sensor array that exceeds 40 sensors, please let me know.
If you are interested in using SeisCloud (https://seis.cloud) but reside in certain countries or regions and are experiencing difficulty accessing SeisCloud (https://seis.cloud) due to connectivity problems, please let me know.
Non-uniqueness of moment tensor inversion in AE monitoring
We introduce a quantitative method to measure the inherent non-uniqueness of the first-polarity-based moment tensor inversion method for acoustic emission monitoring, a problem often exacerbated by the sparse coverage of sensor arrays in laboratory experiments.
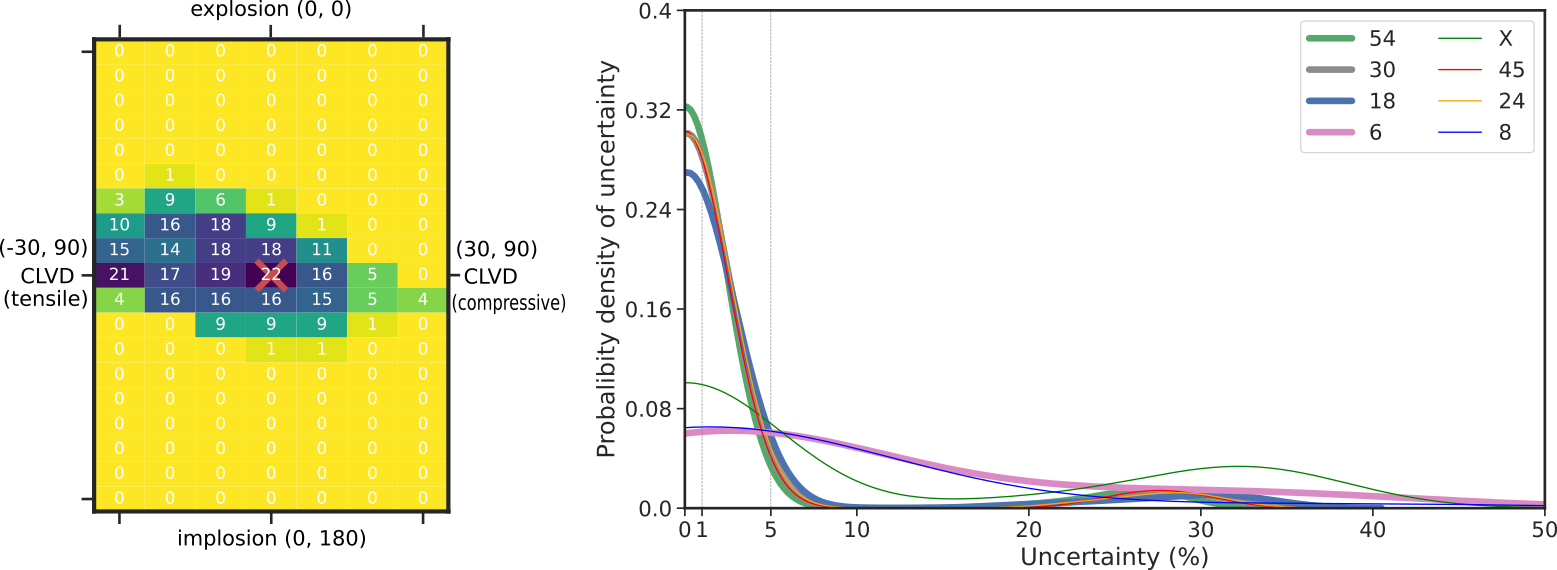
The proposed method can be utilized to examine the reliability and robustness of different sensor arrays in MTI and source type classification. For example, in our study, we use synthetic examples to explore the non-uniqueness using typical sensor array designs. Our results suggest that a sensor array with at least 18 sensors could reduce the overall uncertainty by less than 5%.
Ding, L., Yang, G., Kravchinsky, E., Popoola, A. K., Goodfellow, S., Liu, Q., & Grasselli, G. (2023). Systematic Uncertainty Quantification of First-Polarity-Based Moment Tensor Inversion Due to Sparse Coverage of Sensor Arrays in Laboratory Acoustic Emission Monitoring. Pure and Applied Geophysics. https://doi.org/10.1007/s00024-023-03366-z
(Left: The source type of accepted solutions from moment tensor inversion of an array. Right: The uncertainty distribution for a set of sensor arrays.)
Data Processing
Investigating the failure process through laboratory rock testing and acoustic emission monitoring
- Event detection
- Source Localization
- Focal mechanism inversion
- Velocity Survey and Traveltime Tomography

Stay tuned!
Upcoming enhancements will introduce new features and functionalities in the near future. Stay tuned for these forthcoming updates!
